


As an SEO, one of my favorite tools is Screaming Frog. Its auditing capabilities and ability to identify technical and on-page SEO issues are extensive and provide much insight into the health of a website. When you combine that power with Python and a Python library called Pandas, you can save a ton of time performing SEO audits on websites.
Python is a powerful programming language that is helpful for analyzing data, automating processes, scaling implementation, and much more. (this is a larger subject for a future post). You can download Python from the official website, download an Integrated Development Environment (IDE) like Anaconda, or use an online Python notebook like Google Colab.
What is Python Pandas Library?
Among the many exciting features of Python is a library called Pandas. Pandas is fast, flexible, powerful, and easy to use for things like data visualization, analysis, and data manipulation.
Pandas is most widely used for data science and machine learning. Pandas is built on another Python library named NumPy that [Numpy.org] says “brings the computational power of C and Fortran to Python.” This makes NumPy and Pandas an extremely powerful and fast library that can perform a large range of data analyses.
Pandas and NumPy make up two languages in the SciPy Stack. The SciPy stack includes open-source libraries for mathematics, science, and engineering. These same libraries are powerful for data scientists, SEO, and digital marketers.
SEOs use Pandas to analyze large datasets (CSV exports from SEMrush or Screaming Frog) and find correlations in data (analyzing keyword or algorithm drops), or automating link architecture or keyword research classification.
Now that you know what Pandas is, learn how to get it set up and running on your computer.
How to Install Pandas in Python?
Anaconda
Anaconda is a popular Python installation that makes package management easier. Downloading and installing Anaconda is a simple way to use Pandas and the rest of the SciPy stack. Once you install and run Anaconda, you will have access to Pandas and other libraries that are already installed.
Install from PyPi
Python can also be installed from PyPi through the terminal on your computer.
pip install pandas
How to Import Pandas?
To use Pandas you can open a Notebook in your Python environment. Whether you are using Anaconda or another integrated development environment (IDE) your next step is to import Pandas into your Notebook.
import pandas as pd
Now that you have Pandas installed and imported we are ready to use it to help analyze our data.
How to Use Python to Analyze a Screaming Frog Crawl?
First, we will start by importing all the needed libraries.
import pandas as pd
import matplotlib.pyplot as plt
from urllib.parse import urlparse
import os
Pandas and Matplotlib are two of the libraries that we are importing in the above code. These will be helpful for analyzing, manipulating, and plotting the dataset.
df = pd.DataFrame(pd.read_csv('internal_all.csv', header=0, parse_dates=['Last Modified'])) The next cell we create is a variable called df. We then create a Pandas DataFrame, and read in the CSV file.
print(df.dtypes)
In the next cell, we will go ahead and print out the column data types – float, integer, char, etc.
df['Page Type'] = df['Address'].apply(lambda x: urlparse(x).path.split("/")[1]) Next, we create a new column named ‘Page Type’ and then split the URLs from the Screaming Frog export using a lambda function with a “/” delimiter. The ‘Page Type’ column now holds the URL slug after the .com/ …
aggregated_df = df[['Page Type', 'Word Count']].groupby(['Page Type']).agg('sum') The next line of code creates a variable named aggregate_df, and then we take the newly created page type column and group them by word count, and sums the total word count for that page type group.
print(aggregated_df)
We then print the new data frame.
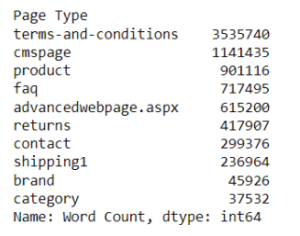
The output above shows the total word count grouped by page type/category. You can see the categories/groups with the highest word count include cms page, product URLs, FAQ pages, and more.
status_code_df = df[['Status Code', 'Address']].groupby(['Status Code']).agg('count')
print(status_code_df)
The next two lines of code create a new variable named status_code_df and uses the groupby method to group and then print the status codes.
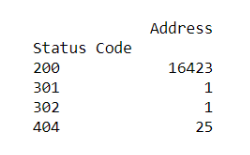
From the output, you can see it looks like we have 25 URLs reporting as 404 errors. We will want to get those cleaned up as soon as possible.
Now let’s look at how to visually plot out status codes that we identified during the Screaming Frog crawl.
status_code_df.plot.bar()
Then, thanks to Matplotlib, we can plot out the grouped status code breakdown with one line of code.
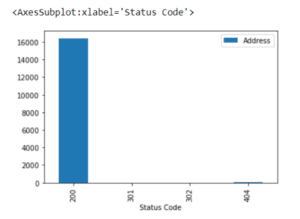
Very cool. With a few lines of code, we were able to group and print out the status codes and then plot out the breakdown. Next, let’s output a list or data frame of URLs that are reporting a status code other than 200.
temp_redirect_df = df[df['Status Code'] == 302][['Address', 'Status Code']]
print(temp_redirect_df)
The above lines of code create a variable and then we grab all URLs reporting a 302 status code or temporary redirect, then print it out using the print() function.
![]()
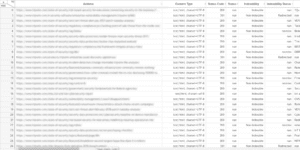
fohundred_errors_df = df[df['Status Code'] > 400][['Address', 'Status Code']]
print(fohundred_errors_df)
Continuing on we create a variable to hold all status codes that are reporting as 400 errors.
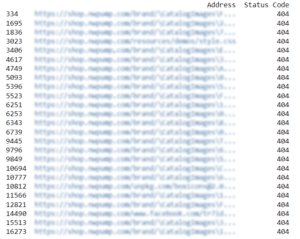
Look at the power of Python and Pandas at work. With a couple of lines of code, we were able to identify and print out all 404 errors. Once you have your notebook all set up, this code can be replicated across hundreds or thousands of crawls. This saves you a ton of time and helps you automate some of the SEO technical audit processes. If you want, Pandas even makes it very simple to quickly export that list to CSV for further analysis.
crawl_depth = df[df['Crawl Depth'] > 3][['Address', 'Crawl Depth']]
print("Crawl depth too deep: \n", crawl_depth)
The next lines of code create a variable and stores a list of all URLs with a crawl depth over 3. We then go ahead using the print() function to print out a preview of the URL list.
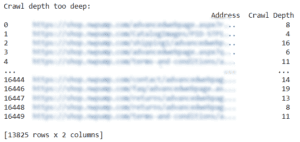
We can see that we have over 13,000 URLs on this domain that take over 3 clicks to reach from the homepage. There appears to be some opportunity to improve internal linking optimization on this domain.
Next, let’s see how to check the robots meta tag for URLs that are preventing indexing or potentially impacting crawling.
noindex = df[df['Meta Robots 1'] == "noindex, nofollow"][['Address', 'Meta Robots 1']]
print('Noindex & Follow: \n', noindex)
The above lines of code create a variable called noindex and then stores any URLs reporting meta robots tags with noindex and nofollow directives. The code could be altered to check for URLs with just noindex tags, or reporting noindex and follow tags for example.
Next, let’s see how we can use Pandas to check our Screaming Frog export for URLs reporting empty title tags.
title_missing = df[df['Title 1 Length'] == 0][['Address', 'Title 1 Length']]
print("Title tag missing: \n", title_missing)
The above code checks for URLs reporting missing title tags then prints out the list of URLs.
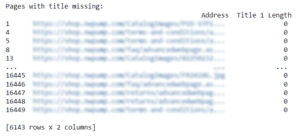
We can see over 6,000 URLs missing title tags from this Screaming Frog crawl. Definitely a technical + on-page SEO issue that we will want to address.
title_too_long = df[df['Title 1 Length'] > 70][['Address', 'Title 1 Length']]
print("Title too long: \n", title_too_long)
Checking for title tag length issues. We create a variable named title_too_long then assign it to all URLs reporting a title tag length over 70 characters. We add the address and title tag length to the list and then print it out.
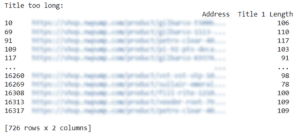
We can see that over 700 URLs have potential title tag length issues from our crawl. This should be further analyzed and then scheduled to be fixed based on the current priorities or SEO roadmap you are working on.
Next, let’s see how we can use a similar method to identify pages missing meta descriptions.
meta_missing = df[df['Meta Description 1 Length'] == 0][['Address', 'Meta Description 1 Length']]
print("Pages with Meta Description missing: \n", meta_missing)
Checking for empty meta descriptions is very similar. We can go ahead and create a variable name meta_missing. Then assign all URLs with meta description lengths of 0 and go ahead and print it out.
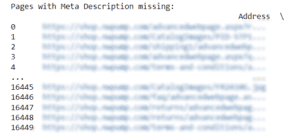
Once again we have identified a large number of URLs with a technical/on-page SEO issue. Over 16,000 pages missing meta descriptions have been identified in our crawl. Now let’s use Pandas to identify pages missing canonical tags.
canonical_missing = df[df[‘Canonical Link Element 1’] == 0][[‘Address’, ‘Canonical Link 1’]] print(canonical_missing)
The final example we will review is how to use Pandas to check for URLs reporting missing canonical tags. Similar to the above lines of code we create a data frame, then assign it all URLs with canonicals equal to 0. Then finally go ahead and print out the list of URLs.
Would you rather just use a Graphical User Interface (GUI) like Google Sheets or Microsoft Excel?
Great! Python has you covered. There are a number of Pandas GUI libraries that can be used to visually analyze the dataset, plot graphs, sort/filter the data, and more. GUIs give you an experience much more familiar to interacting with Microsoft Excel or Google Sheets.
The Pandas GUI we are looking at today is Dtale. This is one of many available, and it is a full-featured GUI that has many plotting and data manipulation abilities.
First, we will go ahead and download the Python D Tale library through our command line.
pip install --upgrade dtale
Now that we have downloaded DTale via the command line. Let’s return to our Jupyter notebook or Colab notebook to set up the GUI library.
import dtale
df = pd.read_csv(‘data.csv’)
d = dtale.show(df)
d.open_browser()
In the above 4 lines of code, we first import the DTale library. Then we create a new data frame name df and read in the CSV file. Once that is done we create another variable called ‘d’ that uses DTale’s .show() method to create a Pandas GUI application. The final line of code uses and open_browser() method to open the data frame in another browser window.
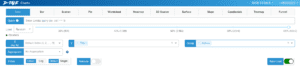
What you end up with is something that looks very similar to the data frame screenshot below.
This data frame feels much like, if not identical, to using Google Sheets or Microsoft Excel. But it doesn’t stop there with Pandas GUIs. They make it extremely simple to perform data analysis and manipulation.
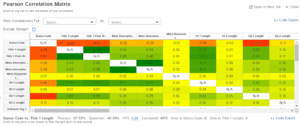
Quickly analyze your dataset using the Pearson Correlation Matrix with the click of a button. This helps identify linear and non-linear relationships between data points.
Or use one of the many plots in Dtale Charts including line, bar, wordcloud, heatmap, 3D scatter, and others.
What’s next? Further Analysis with Pandas and Python
Where can you go from here? The possibilities are endless. You can continue to slice and dice the Screaming Frog export to identify hundreds of potential technical issues. Taking it a step further, you could even merge data together like keyword rankings by URL and a screaming frog export.
Then using the groupby() method you could examine and plot out URL keyword rankings averages grouped by crawl depth. This analysis could come in handy to understand if pages buried in your site aren’t performing as well in search.
With Python, you can take your data analysis skills to a whole new level. Add on Python Machine Learning libraries like TensorFlow, SciPy, SciKit Learn, PyTorch, or others and your co-workers will be looking at you like a data analysis wizard.
Check out my latest Webfor blog post on Python for SEO. Learn about NLP Entity SEO: How to use python for Named Entity Recognition (NER), or explore how to use Python for visualizing an SEO competitor analysis. Hopefully, this introduction to Pandas for SEO post will inspire you to explore Python and how it can help save time, automate the boring stuff, and up your data analysis skills to the next level. Want to chat more about how Python can take you SEO services to the next level? Always love to chat with fellow Pythonista’s so leave a comment below. Leave a comment below
Link to GoogleColab Notebook – Make a copy and save it to your Drive
